Instrumental Audit of an Operational Acoustic Database for Pipeline Leak Detection and AI Training Dataset Curation
Aleksandr Ivanaiskii, PhD
Founder & CEO, Rivixi LLC
Evgeny Ivanaiskii, PhD
Independent Researcher, Pipeline NDT
Sergei Shipilov
AI Engineer
- Companion acoustic audit for RIVIXI Locate: complements the tabular GIS cleaning study (Overcoming Data Chaos) with a reproducible forensic/signal audit of 1,580 primary WAV files (removing
45synthetic tests and600decoded-audio duplicates → 935 unique physical captures). - Selection bias discovery & dual-track curation: applying a
≥ 40 Hzcoherence gate passes 78.3% of stereo leaks vs. only 26.0% of no-leak captures, so binary classification (Track A:355mono +131–133stereo) must omit coherence gating to avoid selection bias, while TDOA localization/ranging (Track B: 80 clean gated stereo captures) strictly enforces coherence + ADC clipping< 1%. - Reference subset (95% Wilson CI): among
35recordings with documented span lengthL, 11/35 (31.4%, 95% CI 18.6–48.0%) clear the signal gate, 10/11 (90.9%, CI 62.3–98.4%) match pipe-record distance ranges, and 3 exhibit confirmed Δt peaks.
Archival Abstract and Metadata (Added for DOI Indexing)
Intake status screening isolated 45 synthetically generated test files, and cryptographic file and decoded-audio hashing identified 600 audio duplicates (596 byte-identical copies), reducing the raw archive to 935 unique physical signals: 733 single-channel (mono) recordings (355 consistently labeled: 143 leak and 212 no-leak) and 202 two-channel (stereo) recordings (148 entering the two-channel verification corpus: 133 canonically labeled and 15 carrying recorded span length L). Evaluating the two-channel corpus through a delay-adapted Welch primary signal gate (≥ 40 Hz contiguous coherent bandwidth with K ≥ 10 averages and full-scale ADC clipping < 1%) admitted 80 stereo recordings out of 148. Within the canonically labeled stereo set, 78.3% of leak recordings passed the ≥ 40 Hz coherence threshold versus only 26.0% of no-leak recordings, indicating that applying a coherence gate to binary leak classification would introduce sample selection bias. Across all 35 reference recordings with pipe-record span length L, gate coverage was 11 of 35 (31.4%; 95% Wilson score CI: 18.6–48.0%), spectral range consistency with the pipe record was 10 of 11 (90.9%) (28.6% overall), and 3 leak records exhibited confirmed cross-correlation delay peaks. Based on Korteweg wave-propagation physics on water-filled steel mains and waveform analysis on DN 700 (NPS 28) trunk lines, the report establishes separate validation gates for field acoustic surveys and dual-track AI training dataset workflows.
Keywords: acoustic leak detection, cross-correlation localization, magnitude-squared coherence, Korteweg wave velocity, data leakage, sample selection bias, ADC clipping, water-filled steel pipelines
Version: 6.0 (November 18, 2026)
Suggested Citation (IEEE): A. Ivanaiskii, E. Ivanaiskii, and S. Shipilov, "Instrumental Audit of an Operational Acoustic Database for Pipeline Leak Detection and AI Training Dataset Curation," Ver. 6.0, Nov. 18, 2026 [Technical Report]. DOI assigned upon repository deposit.
1. Audit Scope and Executive Summary
This report documents an exhaustive instrumental audit of an operational archive of 1,580 acoustic audio files supplied for pipeline leak localization on water-filled steel networks and for constructing artificial intelligence (AI) training datasets.
| Audit Item or Criterion | Measured Result | Status and Engineering Notes |
|---|---|---|
| Delivered source archive | 1,580 WAV files | Measured directly (mixed hardware types and test files) |
| Isolation of synthetics and duplicates | -45 tests; -600 copies | Isolated by intake status (-45 tests) and decoded audio hashes (-600 copies; 935 unique signals) |
| Labeled single-channel stream | 355 mono signals | 143 "leak" / 212 "no-leak"; for 1-ch. classification |
| Two-channel verification corpus | 148 stereo signals | 133 canonically labeled + 15 with pipe-record length L |
| Primary signal gate (≥ 40 Hz, ADC < 1%) | 80 stereo signals | Confirmed inter-channel coupling and absence of full-scale ADC clipping |
| Reference subset with pipe-record length L | 35 pipe records | Admitted coverage 11/35 (31.4%); range match 10/11 (90.9%) |
| Candidates with delay peak Δt and length L | 3 stereo records | Spans 64, 64, and 137 m |
Standard ingestion scripts can parse the archive and train neural networks without raising runtime exceptions, yet doing so conflates incompatible acquisition hardware (single-channel acoustic noise loggers versus two-channel correlators), repeated copies of identical field visits, and conflicting pipe records (referred to as a pipe "passport" in the source documentation). The sections below quantify the selection funnel, physical signal parameters, failure modes, and separate validation gates for field measurements and dataset assembly.
2. Archive Inventory, Physical Stream Parameters, and Workflow Separation
In the initial inventory pass, the inventory module computes cryptographic hashes over both the raw file bytes and the decoded PCM audio samples, logs channel counts, sampling rates fs, and durations, and reconciles diagnostic labels and pipe records across duplicate copies.
Table 1. End-to-End Selection Funnel from 1,580 Files to Single- and Two-Channel Operational Streams
| Audit Stage | Remaining | Change | Transition Explanation and Status |
|---|---|---|---|
| 1. Delivered source archive | 1,580 | unchanged | Complete corpus of transferred WAV files |
| 2. Field registry excluding synthetics | 1,535 | -45 | Excluded 45 synthetically generated test signals (§3.3) |
| 3. Unique physical audio signals | 935 | -600 | Removed 600 audio duplicates among 1,535 (596 byte-identical) |
| 4a. Single-channel signals (and labeled subset) | 733 (355 labeled) | unchanged | Routed to 1-ch. stream (143 "leak", 212 "no-leak"; 378 unlabeled) |
| 4b. Unique 2-channel signals (stereo) | 202 | unchanged | Consolidated from 350 stereo files; base pool for 2-ch. analysis |
| 5. Two-channel verification corpus | 148 | -54 | 133 canonically labeled (83 leak / 50 no-leak) + 15 with length L |
| 6a. Baseline coherence ≥ 40 Hz (short window) | 63 | -85 | 57 assigned distance range + 6 rejected by HF filter (> 2,400 Hz) |
| 6b. Delay-matched Welch segment alignment | 74 | +11 | Eliminated window truncation bias on long pipe spans |
| 6c. Full-duration sliding scan | 82 | +8 | Bypassed transient local interference at recording onset (55.4% of 148) |
| 7. Passed primary signal gate (ADC < 1%) | 80 | -2 | Blocked 2 coherent records with full-duration ADC clipping (63 leak / 13 no-leak / 4 unlabeled) |
Table 1 summarizes the multi-stage data selection funnel and final corpus structure. Among the 202 unique two-channel recordings, canonical registry verification confirms unambiguous labels for 133 signals (83 "leak", 50 "no-leak"), detects direct label contradictions across copies for 5 signals, and finds no registry label for 64 signals (of which 2 resided in source directories named "leak"). The 148-record verification corpus merges all 133 canonically labeled signals with 15 stereo recordings carrying pipe-record span length L (12 lacking a registry label and 3 with label conflicts). The remaining 54 excluded stereo recordings (202 − 148) lack both a recorded span length L and inclusion in the canonical 133 set: 50 are completely unlabeled, 2 carry only a "leak" folder name, and 2 exhibit label conflicts without a span length L.
Within the 733 single-channel signals, 355 recordings share consistent folder and registry ground truth (143 "leak" or 40.3%, 212 "no-leak" or 59.7%, including 59 stationary noise-logger records: 30 leak and 29 "no-leak"). Although mono recordings are physically incapable of two-sensor cross-correlation localization, these 355 signals provide a valid labeled pool for single-channel leak classification.
Passing Stage 7 (80 records) signifies clearing the primary signal gate (a contiguous coherent band ≥ 40 Hz and absence of full-duration ADC clipping). Within the 83 canonically labeled "leak" stereo recordings, 65 (78.3%) pass the ≥ 40 Hz coherence gate; within the 50 "no-leak" recordings, only 13 (26.0%) pass, whereas 37 (74.0%) stay below 40 Hz (Fig. 1, right). Discarding those 37 quiet "no-leak" recordings from the "no-leak" training class is methodologically invalid because it introduces sample selection bias [14] (see §7).
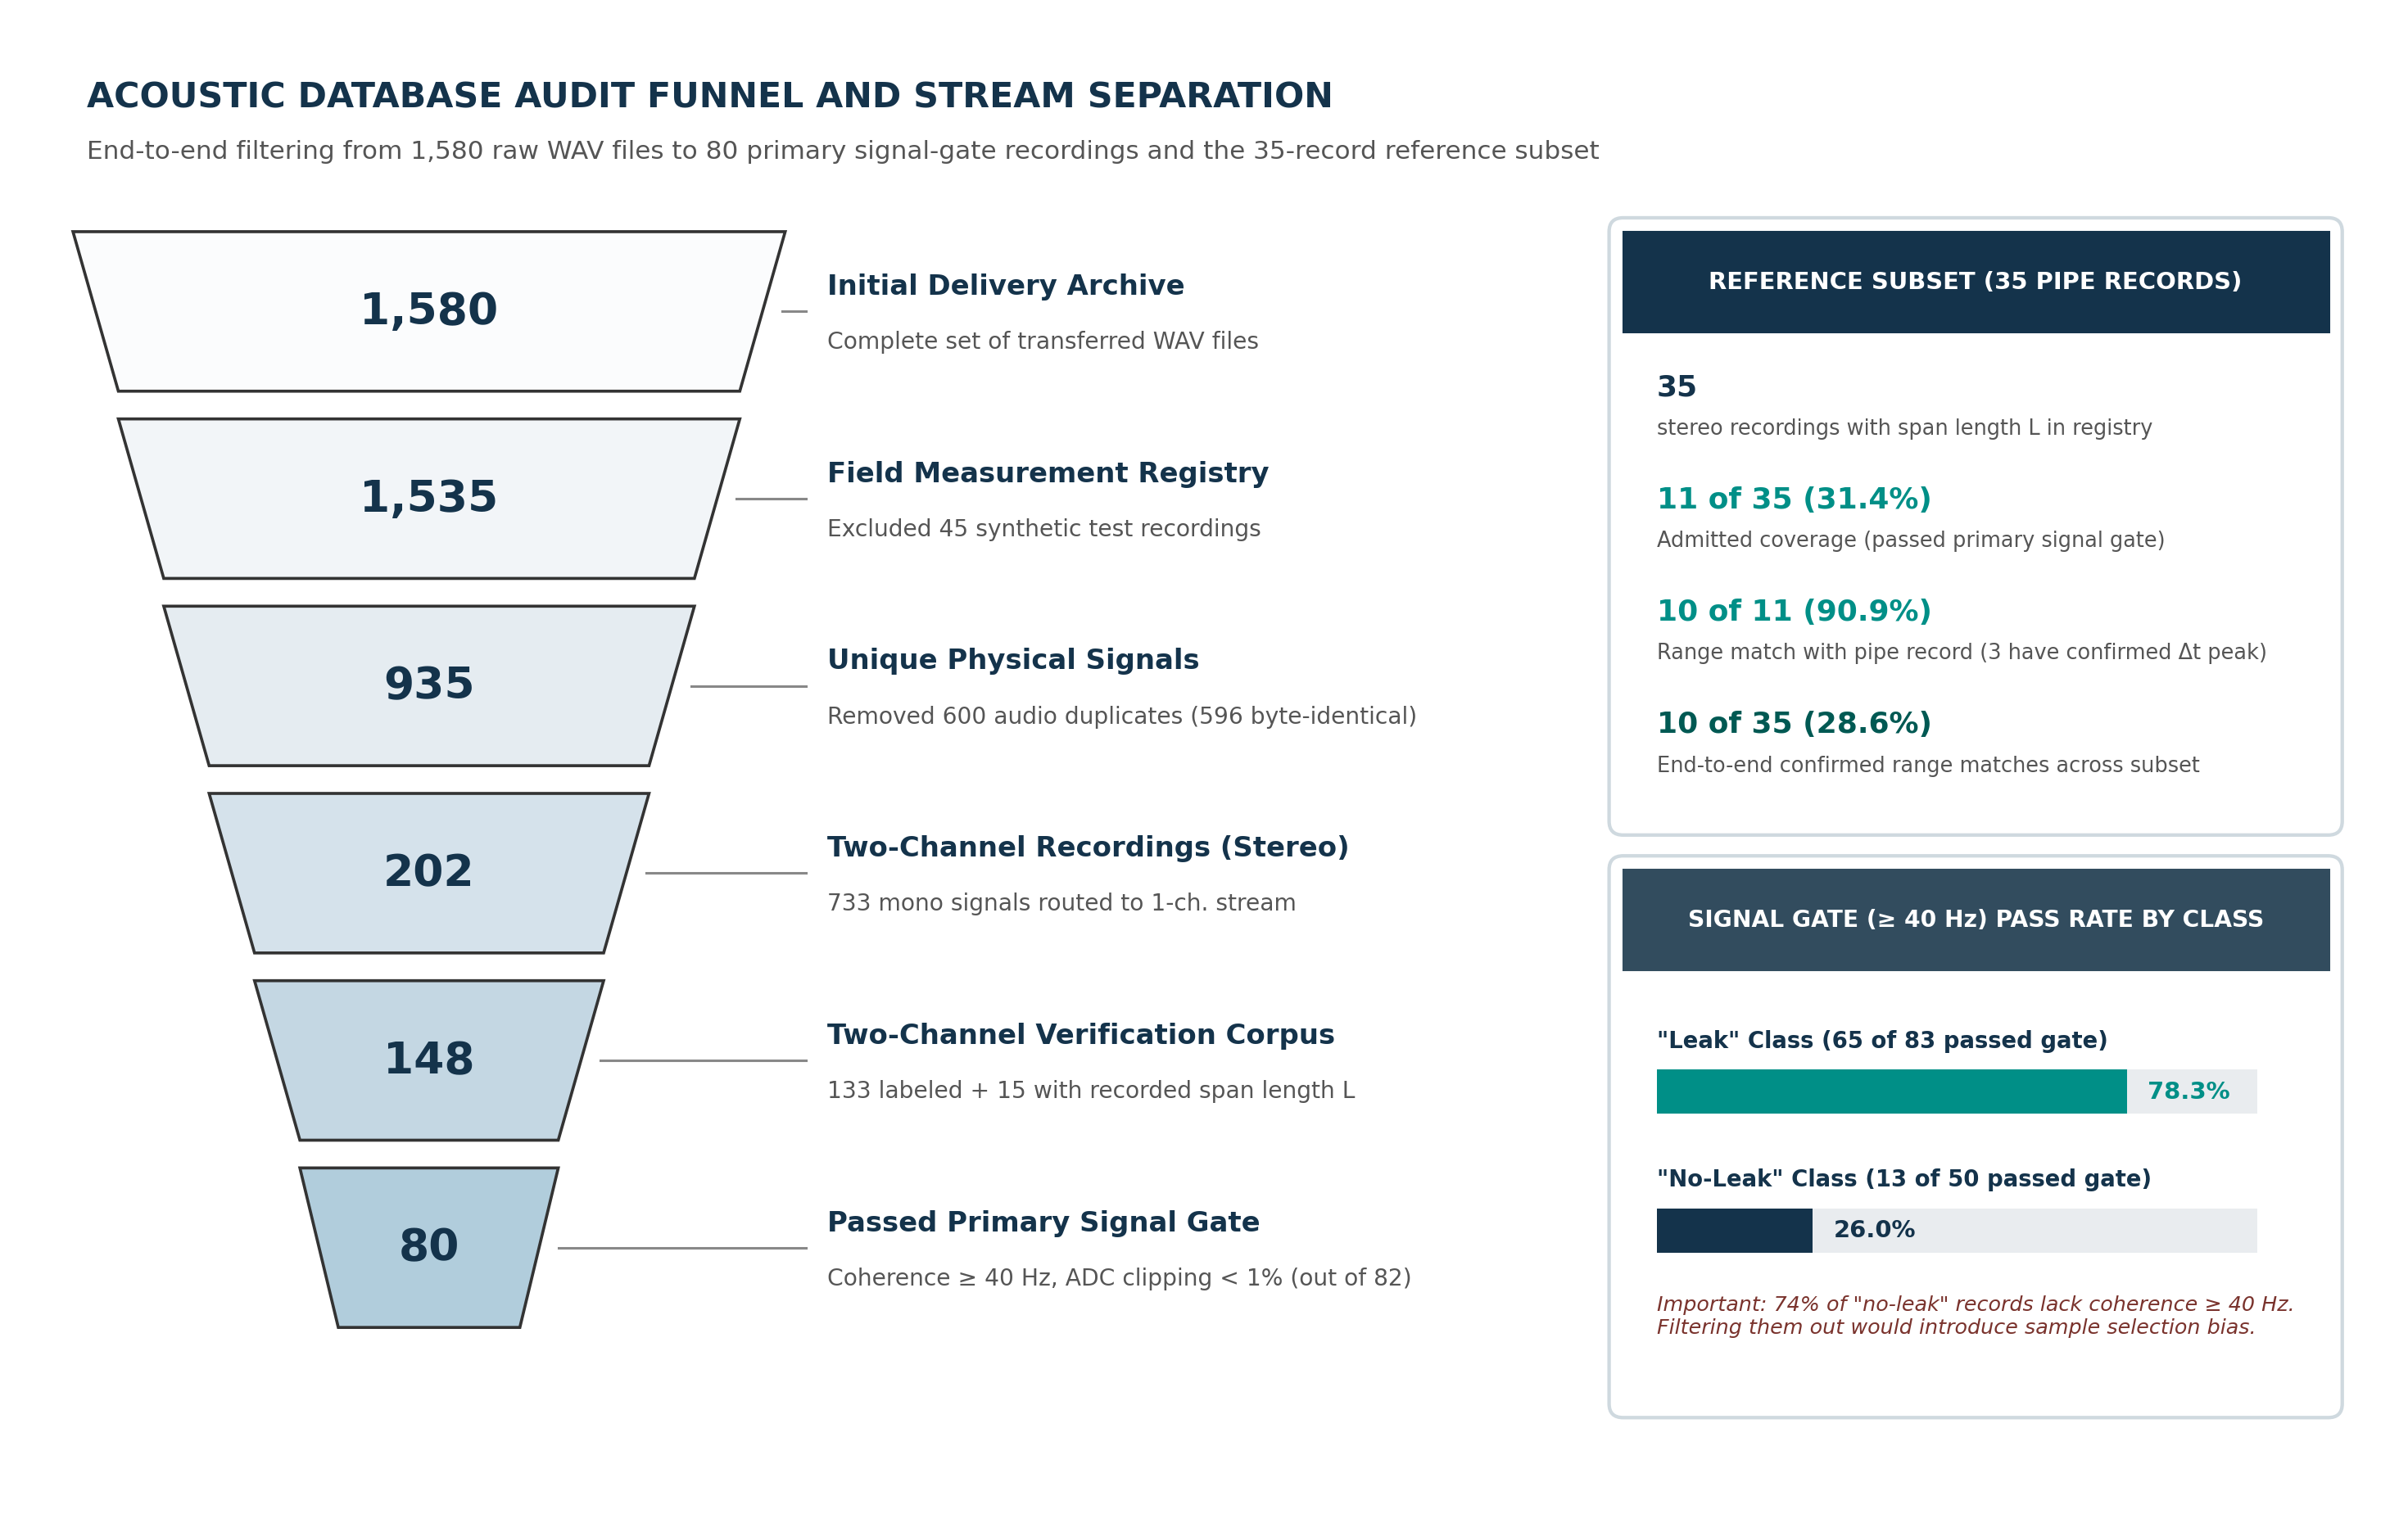
Fig. 1. Left: geometric selection funnel from 1,580 primary WAV files to 80 recordings clearing the primary signal gate. Right: validation outcomes on the 35-record reference subset and class-conditional pass rates across the ≥ 40 Hz coherence threshold.
Physical acquisition parameters differ sharply across the two archive streams by instrumentation type (Fig. 2):
- Two-channel stream (202 unique stereo signals from 350 WAV files): In 98.0% of recordings (198 of 202), the sampling rate lies at fs = 21,333–22,050 Hz (106 at 21,362 Hz, 63 at 21,333 Hz, 29 at 22,050 Hz; isolated files occur at 18,016, 6,554, and 44,100 Hz). Recording durations span 0.7 s to 180 s (median 120 s, 10th percentile 3.0 s: 113 recordings in 91–130 s, 24 longer than 130 s, 21 in 40–90 s, 12 in 5–30 s, and 32 shorter than 5 s).
- Single-channel stream (733 unique mono signals): Sampling rates concentrate in the low-to-mid audio band fs = 1,638–8,092 Hz (528 records at 6,554 Hz of 3.1 s duration, 108 at 4,096 Hz, 56 at 8,092 Hz, 40 at 1,638 Hz, and 1 at 24,000 Hz). Durations are shorter than 5 s in 529 (72.2%) files, 5–30 s in 198 (27.0%), and above 40 s in only 6 (0.8%).
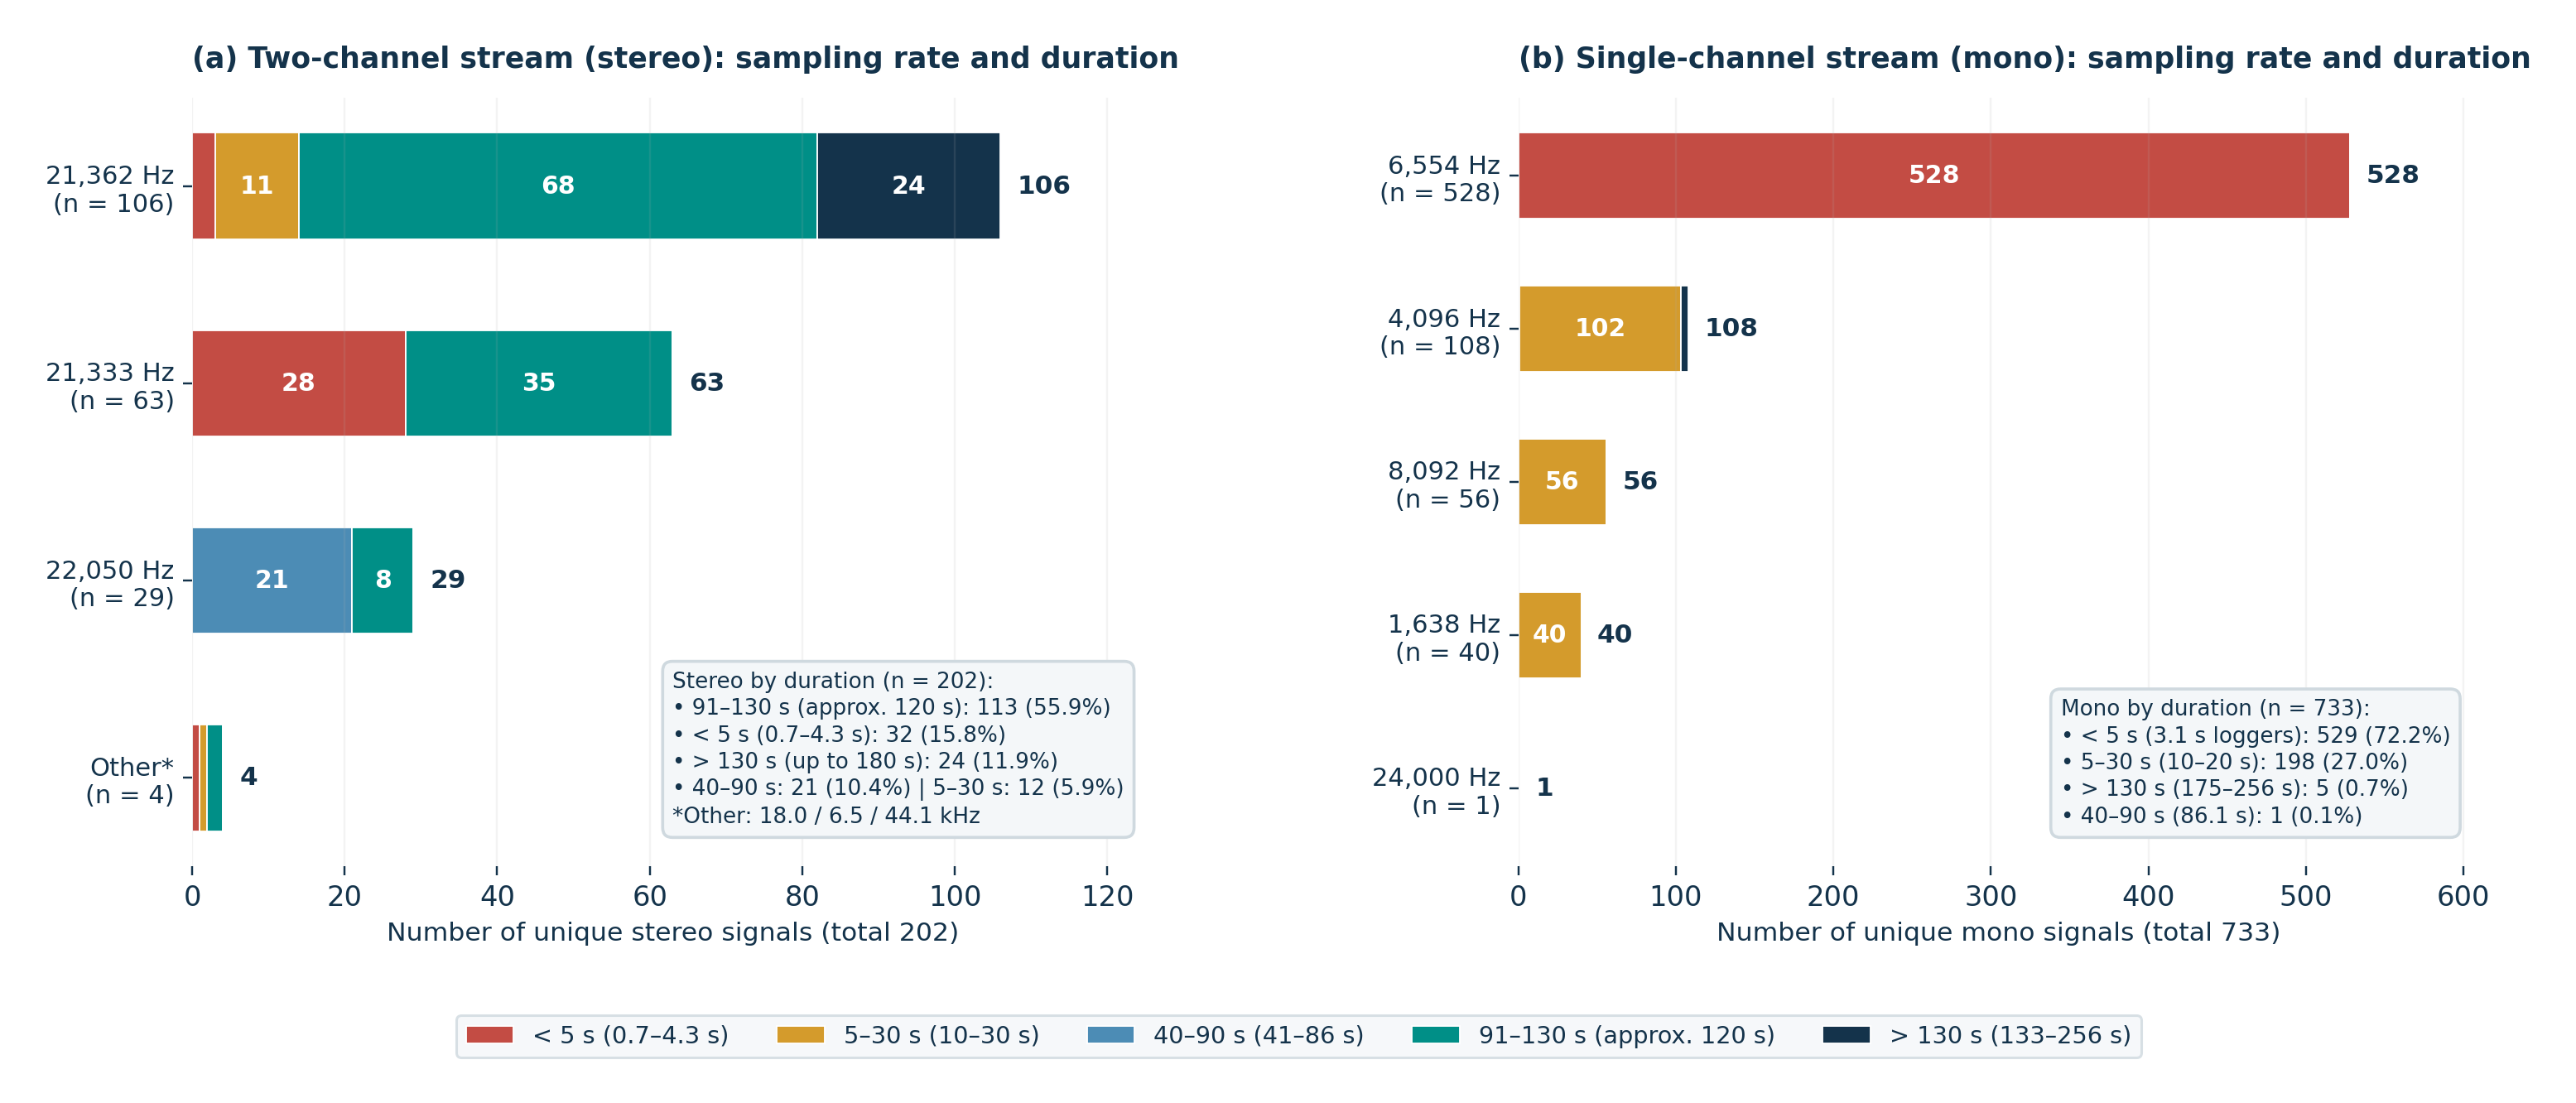
Fig. 2. Two-level distribution of unique physical signals by sampling rate and recording duration bin: (a) two-channel stereo stream (n = 202); (b) single-channel mono stream (n = 733).
3. Structural Archive Defects: Duplicates, Label Conflicts, and Synthetic Signals
3.1. File Duplication and Data Leakage Risk
Cryptographic digest comparison across the 1,535 field WAV files identified 596 exact byte-for-byte duplicates (38.8%) and 600 decoded-audio duplicates (39.1%); four duplicate pairs differed solely in container header metadata.
Under naive random train-test splitting by filename, renamed copies of a single survey recording leak into both partitions (Fig. 3a). This data leakage allows neural models to memorize survey-specific ambient backgrounds rather than physical leak acoustics, artificially inflating test metrics [16, 17]. The inventory module collapses duplicates into 935 audio-hash clusters, and dataset partitioning must be enforced at the cluster and field-campaign block level [24].
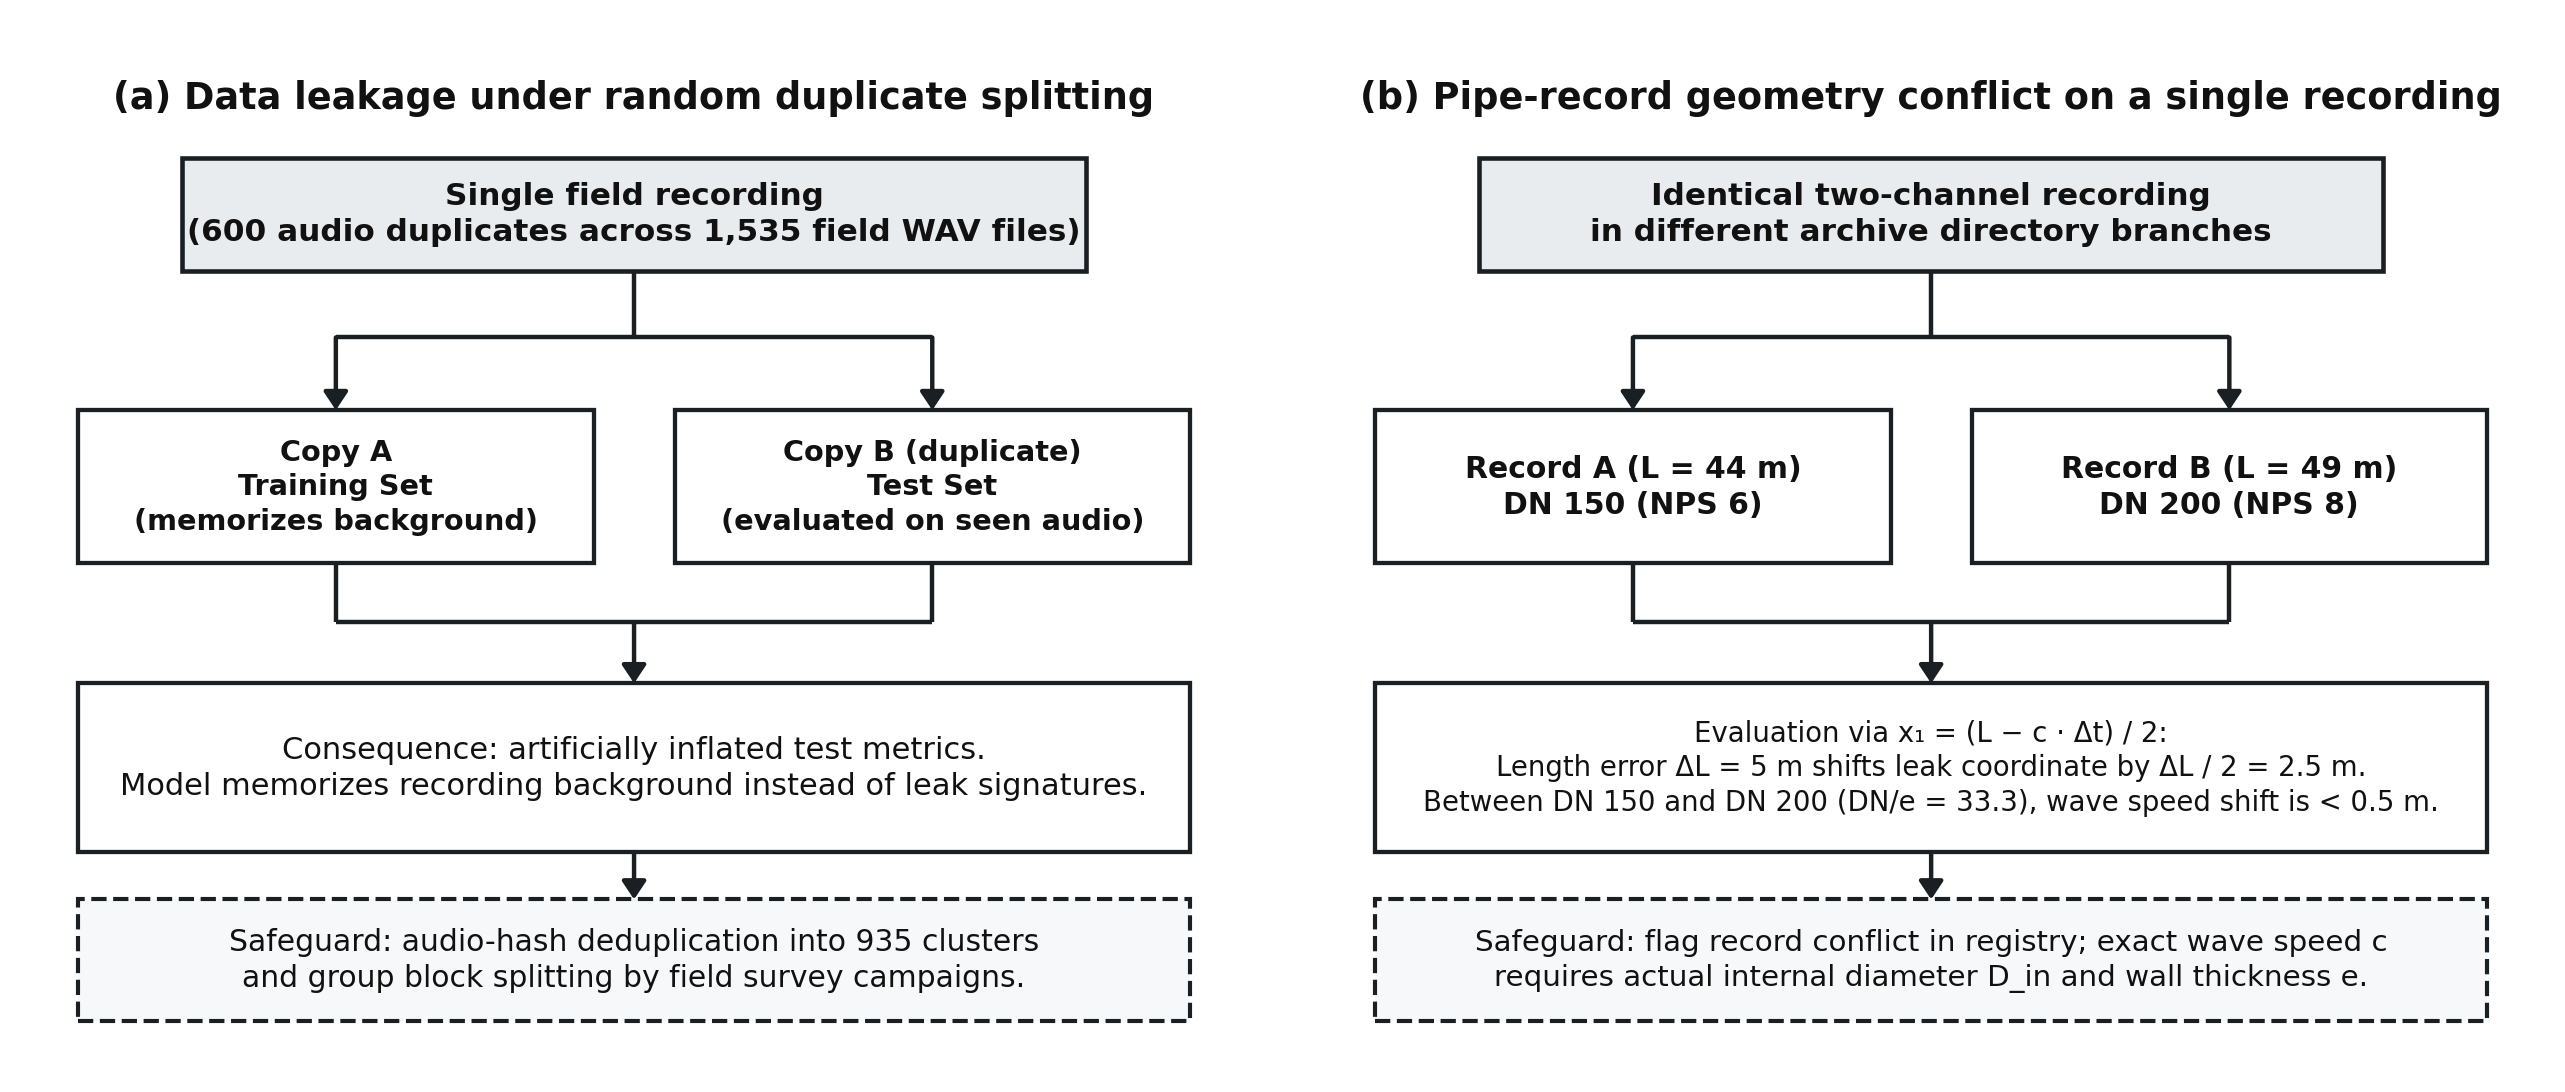
Fig. 3. (a) Data leakage induced by splitting identical acoustic captures across training and test sets; (b) documented pipe-record geometry conflict on a single stereo capture and relative coordinate shift from length error versus nominal size discrepancy.
3.2. Diagnostic Label Conflicts
Cross-checking labels across the 935 unique signal clusters flagged 5 unique stereo recordings (28 files in the archive) simultaneously filed under both "leak" and "no-leak" across different directory trees. Resolving conflicts by copy count is invalid; all five conflicting clusters are excluded from supervised classification training.
Furthermore, supplying an erroneous span length L from a pipe record to a two-channel correlator shifts the computed leak position x1 (measured from Sensor 1), where Δt = t2 − t1 [10, 18] (Δt > 0 indicates later wave arrival at Sensor 2):
where c is the acoustic phase velocity in the pipe and |Δt| ≤ L / c. Varying L leaves the cross-correlation waveform unchanged while linearly shifting both x1 and the physically admissible delay envelope.
3.3. Isolation of Synthetic Test Signals
During intake screening, 45 WAV files were flagged as synthetically generated bench test signals and isolated prior to constructing the operational field registry (1,580 reduced to 1,535), based on their status recorded at acceptance in the audit protocol. Mixing synthesized signals with operational captures corrupts classifier training: algorithms and neural networks separate clean synthesizer stationarity from real transducer noise floors instead of learning physical leak acoustics. Synthetic captures are stored separately for bench testing.
4. Geometric Pipe-Record Audit: Span Length L, Nominal Size (DN/NPS), and Transition Zones
4.1. Criticality of Span Length L, US/EU Standards, and Applicability Bounds of the Korteweg Equation
Metadata reconciliation exposed conflicting pipe records linked to an identical stereo cluster (Fig. 3b): one directory assigned Record A (L = 44 m, DN 150 / NPS 6), whereas another assigned Record B (L = 49 m, DN 200 / NPS 8).
In accordance with international standard ISO 6708:1995 [2], North American NPS specifications (ASME B36.10-2022 [3], ASTM A53/A53M-24 [4], ANSI/AWWA C200-23 [5], AWWA Manual M11 [6]), and European steel pipe dimensions (ISO 4200:1991 [1], EN 10220:2002 [7], EN 13941-1:2019+A1:2021 [8]), nominal pipe designation (DN / NPS) is a dimensionless identifier rather than an exact internal bore measurement. Rigorous calculation of the Korteweg axisymmetric wave propagation speed c [19] in a water-filled elastic steel pipe requires the true internal diameter Din = Dout − 2e and wall thickness e:
where c0(T) and ρ(T) denote the speed of sound in pure water and fluid density at temperature T per the IAPWS-95 formulation [25] (at 20 °C: c0 = 1,482.3 m/s, ρ= 998.2 kg/m3), and Es = 2.06 × 10¹¹ Pa is Young's modulus for steel.
Model Applicability Boundary. The wave velocities tabulated below (1,100–1,440 m/s) apply strictly to water-filled steel pipes free of gas or air pockets [13, 19, 23]. Free gas entrainment substantially reduces phase velocity, requiring field velocity calibration before applying delay bounds.
The table below reports indicative analytical velocities across standard steel pipe sizes (referencing typical wall thickness e from [1, 3, 7] and standard metric-to-inch mapping: DN 50 = NPS 2, DN 80 = NPS 3, DN 100 = NPS 4, DN 150 = NPS 6, DN 200 = NPS 8, DN 700 = NPS 28, DN 800 = NPS 32). For DN 200 (NPS 8) with e = 6.0 mm at 100 °C, substituting nominal 200 mm yields 1,318.8 m/s, whereas the exact internal diameter Din = 207.1 mm (219.1 mm OD minus 2e) gives 1,312.6 m/s (0.47% difference), and the outer diameter 219.1 mm yields 1,302.2 m/s (1.26%).
| Nominal Size DN (NPS) and Wall e [1, 3, 7] | Ratio DN/e | Est. c (100 °C), m/s | Est. c (70 °C), m/s | Est. c (10 °C), m/s |
|---|---|---|---|---|
| DN 50 (NPS 2, e = 3.5 mm) | 14.3 | 1,433.9 | 1,441.2 | 1,352.4 |
| DN 80 (NPS 3, e = 4.0 mm) | 20.0 | 1,396.2 | 1,402.3 | 1,319.4 |
| DN 100 (NPS 4, e = 4.5 mm) | 22.2 | 1,382.4 | 1,388.0 | 1,307.2 |
| DN 150 (NPS 6, e = 4.5 mm) | 33.3 | 1,318.8 | 1,322.5 | 1,250.8 |
| DN 200 (NPS 8, e = 6.0 mm) | 33.3 | 1,318.8 | 1,322.5 | 1,250.8 |
| DN 700 (NPS 28, e = 10.0 mm) | 70.0 | 1,158.3 | 1,158.0 | 1,106.3 |
| DN 800 (NPS 32, e = 11.0 mm) | 72.7 | 1,148.5 | 1,148.1 | 1,097.4 |
First-order perturbation of the Korteweg relation in terms of the dimensionless diameter-to-wall ratio X = Din / e demonstrates weak square-root velocity sensitivity:
For water-filled steel (α≈ 0.010–0.011, X = 14–73), the pipe compliance factor αX / (1 + αX) spans only 0.13–0.44. Differentiating x1 = (L − c · Δt) / 2 therefore establishes a strict engineering error hierarchy:
- Span length error ΔL uniformly shifts the predicted leak coordinate along the entire span by δxL = ΔL / 2 (for the 44 m vs. 49 m conflict, the localization bias equals 2.5 m).
- Relative wave speed error δc / c produces a shift δxc = (δc / c) · (x1 − L / 2) that vanishes at mid-span and reaches at most |δc / c| · L / 2 adjacent to a sensor. Because DN 150 and DN 200 share a nearly identical ratio DN/e ≈ 33.3, substituting one for the other alters c minimally (causing < 0.5 m shift under actual wall thicknesses). Assuming a fixed nominal velocity of 1,200 m/s introduces 14–16% error on DN 80 lines, compared with 3.5–3.6% on DN 700 trunk mains (note that the drop toward 1,106.3 m/s at 10 °C reflects increased bulk compressibility of cold water [25]).
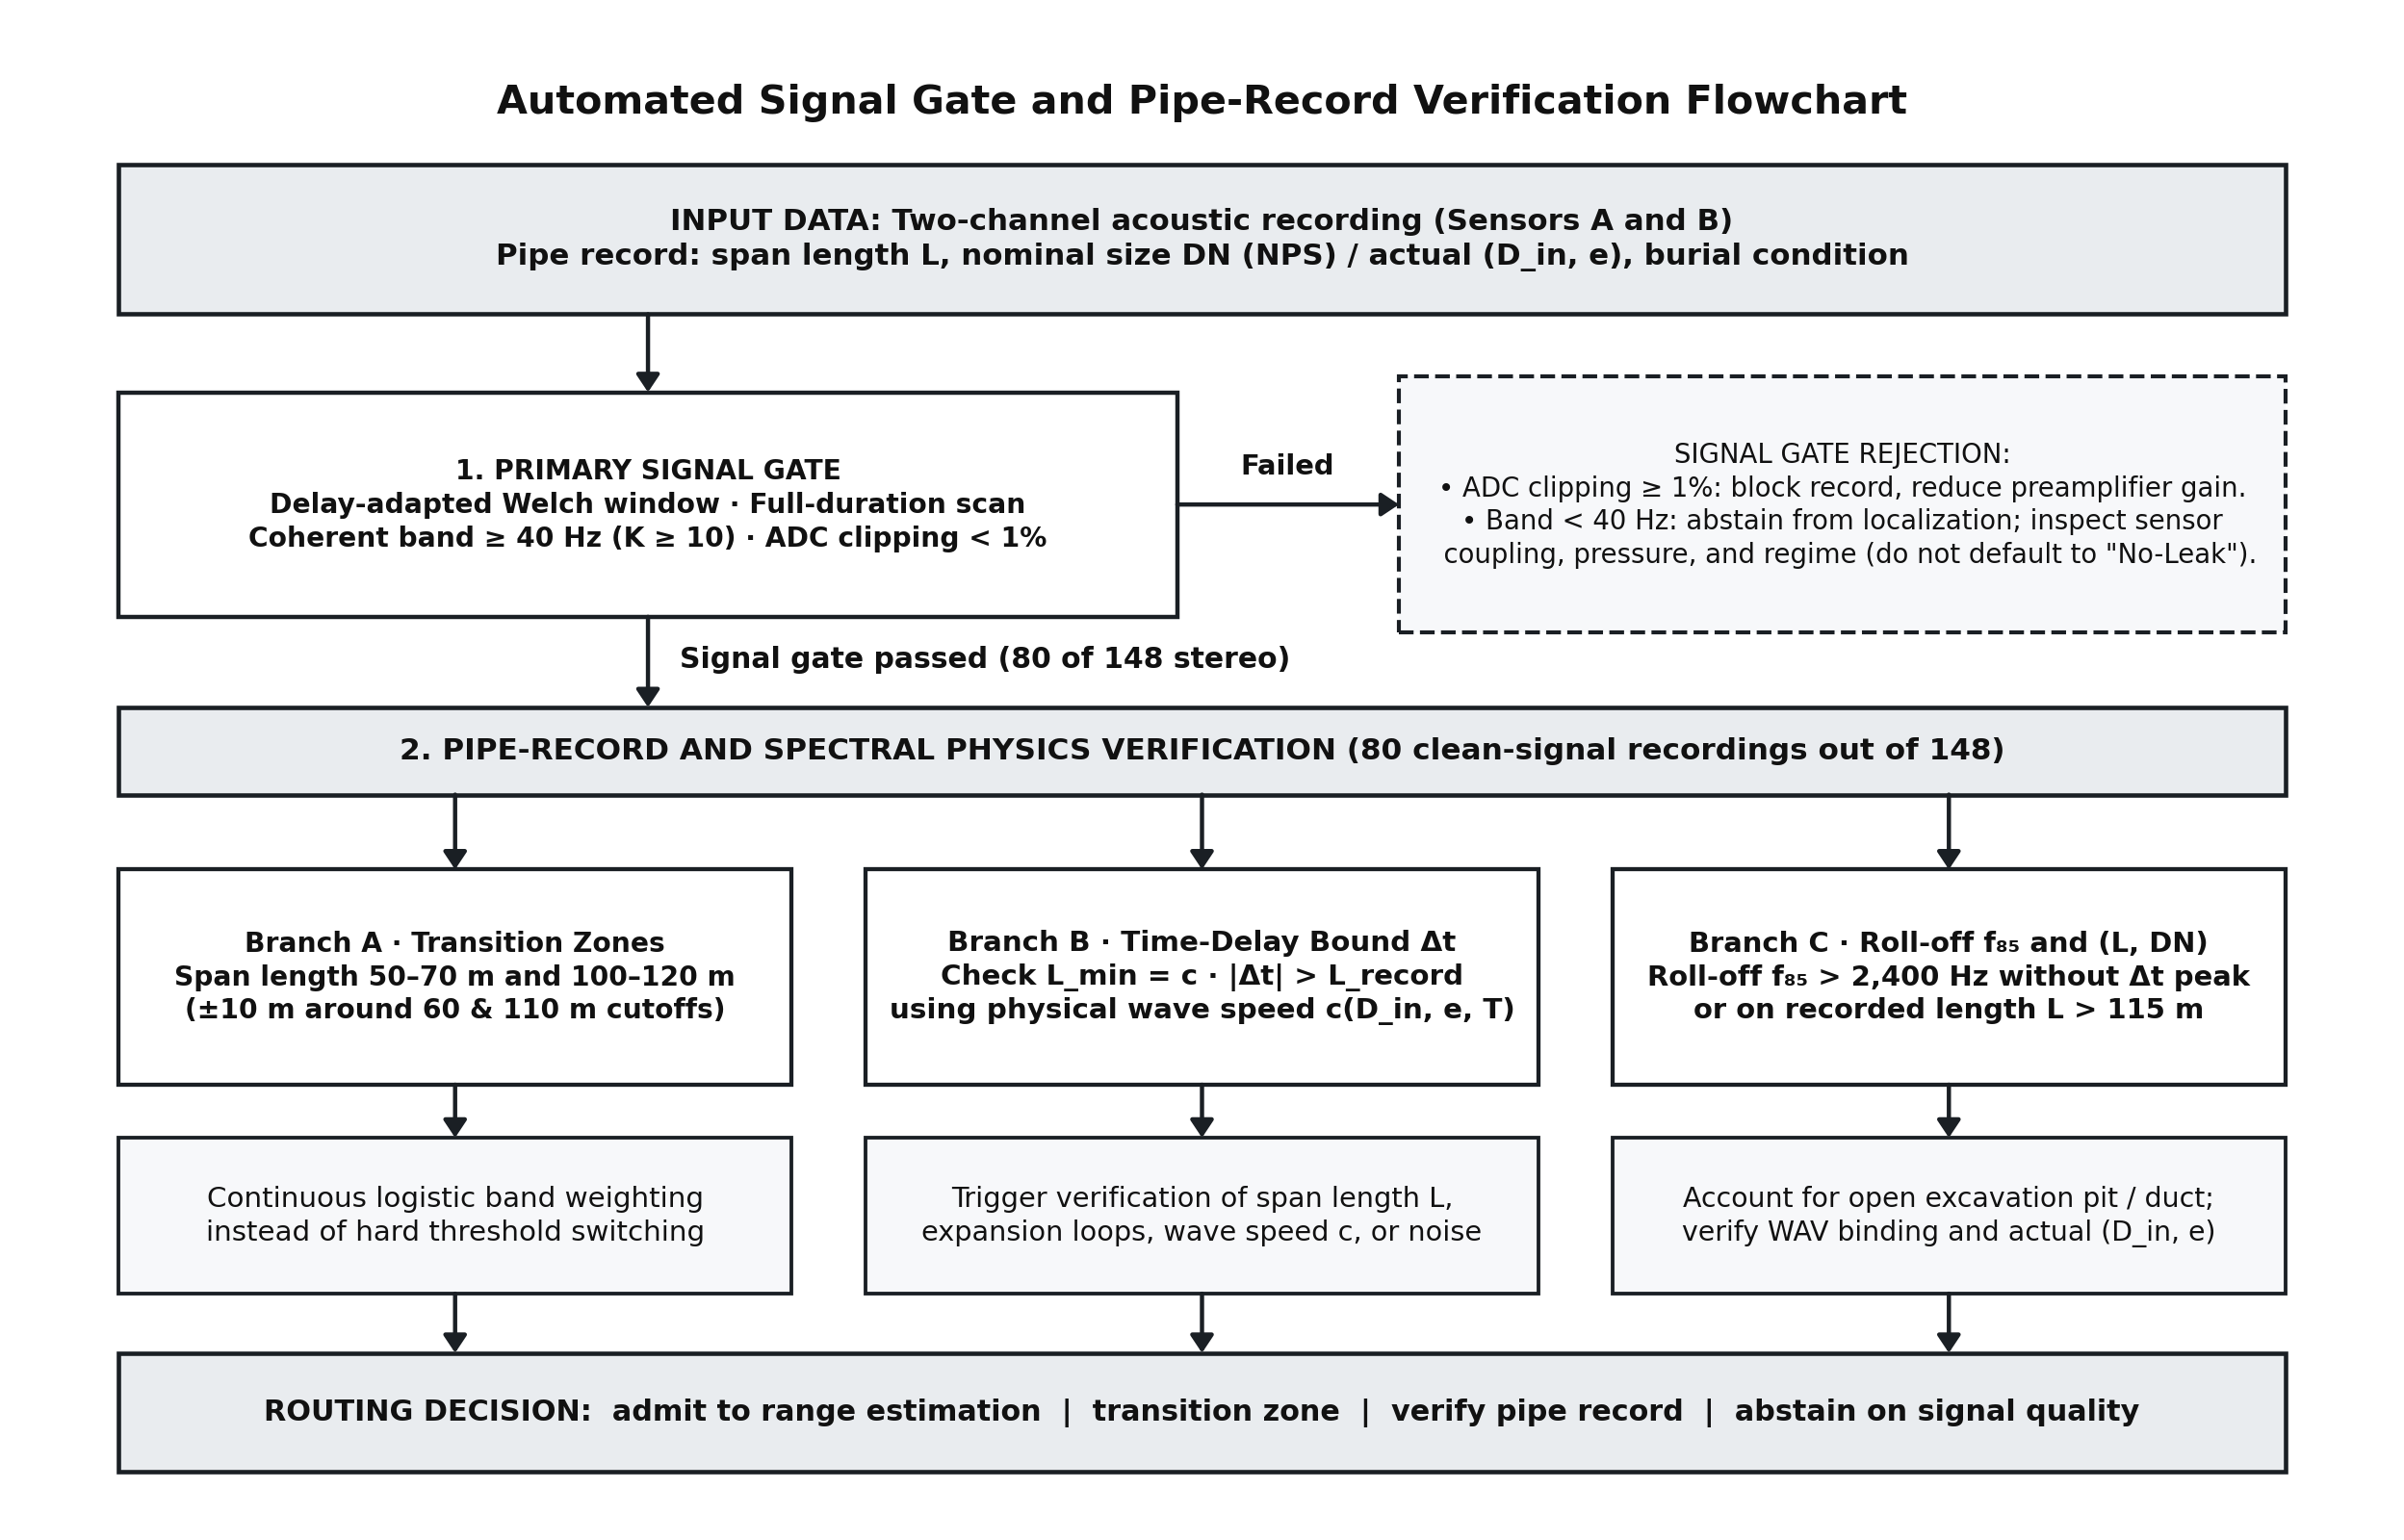
Fig. 4. Flowchart of the automated primary signal gate and pipe-record physics verification.
4.2. Transition Zones and Time-Delay Consistency Checks
Reconciling spectral attenuation classes against pipe records reveals three recurring boundary or conflict conditions (Fig. 4):
-
Attenuation regime transition zones (50–70 m and 100–120 m). In this report, transition zone strictly designates the ± 10 m intervals straddling the distance-regime boundaries (60 m and 110 m). Because soil-pipe acoustic attenuation varies smoothly with distance, continuous logistic band weighting replaces hard threshold switching across these intervals. Near-sensor zones (roughly the first 10 m from either transducer), where Δt approaches ± L / c and local fittings dominate spectral shape, require separate treatment.
-
Acoustic path-difference lower bound (Lmin = c · abs(Δt) > Lrecord). Whenever a reliable correlation peak is established (§5), Lmin bounds the minimum physical difference between the two acoustic propagation paths:
Lmin = c · |Δt|Observing Lmin > Lrecord does not prove the presence of a specific structural feature such as a U-shaped thermal expansion loop; rather, it flags four candidate causes for field verification: unmapped routing geometry (bends, bypasses, expansion loops), surface survey error in L, overestimated wave velocity c (such as gas pockets in the water column), or a spurious correlation peak from periodic machinery interference.
-
Spectral roll-off f85 cross-checks on DN 80 (NPS 3) / 112 m and a 36 m open excavation pit:
- On a recording carrying DN 80 (NPS 3) / 112 m, individual channel roll-offs measured 2,525 Hz and 1,107 Hz, the joint coherent roll-off f85 reached 2,358–2,368 Hz (bordering the 2,400 Hz HF anomaly gate), and a prominent delay |Δt| = 28.4 ms (Sensor 1 lead) at c = 1,402.3 m/s (70 °C) yielded Lmin = 39.8 m. Under L = 112 m, this maps to a leak at x1 = (112 − 39.8) / 2 = 36.1 m from Sensor 1 and x2 = 75.9 m from Sensor 2, qualitatively consistent with the 2,525 vs. 1,107 Hz spectral asymmetry. However, if the true field span were actually a short 40 m service line, the span-length discrepancy alone would displace the coordinate by (112 − 40)/2 = 36 m. Spectral balance cannot resolve L ambiguity independently, so this capture is flagged for field survey verification.
- On a reference 36 m open excavation pit (Dout = 219 mm, DN 200 / NPS 8, thinned pipe wall), measurements showed transmission above 1,600 Hz accompanied by a narrowband peak at 180–480 Hz. Absence of surrounding soil backfill in an open excavation pit reduces attenuation in the pipe wall, causing an unflagged open excavation pit spectrum to mimic a shorter buried pipe [21, 22]. Working audit hypothesis: the 180–480 Hz resonance is not the axisymmetric shell ring frequency fring ≈ cL / (πD) (which lies near 7.5–8 kHz in air and 3–4 kHz in water for 219 mm steel pipe [13, 20, 23]), and is hypothesized to represent a localized flexural or standing mode specific to that open excavation pit span that should not be generalized without multi-site statistics.
5. Primary Signal Gate: Mathematical Definitions and Corpus Filtering
Admission to distance-range estimation and time-delay extraction requires explicit mathematical criteria reproducible on a standard FFT signal processing stack:
-
Welch magnitude-squared coherence estimation. Both channels are aligned to a common [50 Hz; 3,500 Hz] analysis band via polyphase anti-aliasing resampling, and auto-/cross-power spectral densities are estimated using Welch's averaged periodogram method [9, 11, 26] with a Hann taper and 50% segment overlap:
γ2(f) = |PAB(f)|2 / (PAA(f) · PBB(f))-
Segment duration Tw and ensemble count K: When an earlier baseline algorithm used a fixed short analysis window, inter-channel propagation delays Δt on long spans shifted coherent energy outside the segment overlap, artificially depressing coherence [9–11]. Extending the Welch segment length to comfortably exceed the maximum acoustic transit time L / c while maintaining at least 10 overlapping averages (K ≥ 10–15 across the selected window) eliminates delay truncation bias. By Carter's sampling distribution [11], the 95th-percentile false coherence bound for uncorrelated Gaussian noise is:
γ20.95(K) = 1 − 0.051/(K−1)This critical value equals 0.146 at K = 20, 0.283 at K = 10, and rises to 0.527 on short captures of a few seconds (K ≤ 5). Consequently, a uniform γ2(f) ≥ 0.30 threshold is statistically valid only for K ≥ 10; shorter recordings require either an adaptive cutoff γ2crit(K) or longer field acquisitions supporting at least 10–15 averages. Requiring a contiguous coherent bandwidth Δf ≥ 40 Hz suppresses single-tone electromagnetic or pump harmonics (50 Hz, pump).
-
-
85% coherent spectral roll-off f85 and distance bands. To reject single-channel transducer noise, the joint coherent power spectrum Pcoh(f) is evaluated solely over frequency bins belonging to contiguous coherent bands (γ2 ≥ 0.30, Δf ≥ 40 Hz):
Pcoh(f) = γ2(f) · min(PAA(f), PBB(f)), Σfi ≤ f85 Pcoh(fi) / Σfi Pcoh(fi) ≥ 0.85Here f85 defines the 85th-percentile cumulative coherent power frequency within the 50–3,500 Hz band. Distance classes follow three frequency regimes: short range (≤ 60 m) for f85 > 1,600 Hz, medium range (60–110 m) for 750 < f85 ≤ 1,600 Hz, and long range (> 110 m) for f85 ≤ 750 Hz, with smooth logistic blending across the 50–70 m and 100–120 m transition zones.
-
Correlation peak prominence ≥ 1.20 and main-lobe dead zone. Time delay Δt is extracted from the global maximum Rmax of phase-transformed generalized cross-correlation (GCC-PHAT [18]) within |Δt| ≤ 350 ms. A ± 2 ms dead zone (main-lobe width) around Rmax is masked before identifying the strongest secondary peak R2. A delay peak is certified only when Rmax / R2 ≥ 1.20 and |Δt| ≥ 1.5 ms (guarding against zero-lag common-mode electrical pickup).
-
High-frequency anomaly gate (2,400 Hz) and 1% full-scale ADC clipping rule. The filter f85 > 2,400 Hz blocks distance assignment whenever no valid Δt peak exists (capturing local high-frequency noise from pipe fittings or poor sensor contact even on 49 and 77 m spans) and flags a pipe-record discrepancy on spans exceeding L > 115 m (Fig. 4). Potential full-scale ADC clipping is flagged whenever at least 1% of samples within an analysis window reach the 16-bit PCM full-scale bounds (± 32,767 / ± 32,768, Fig. 5).
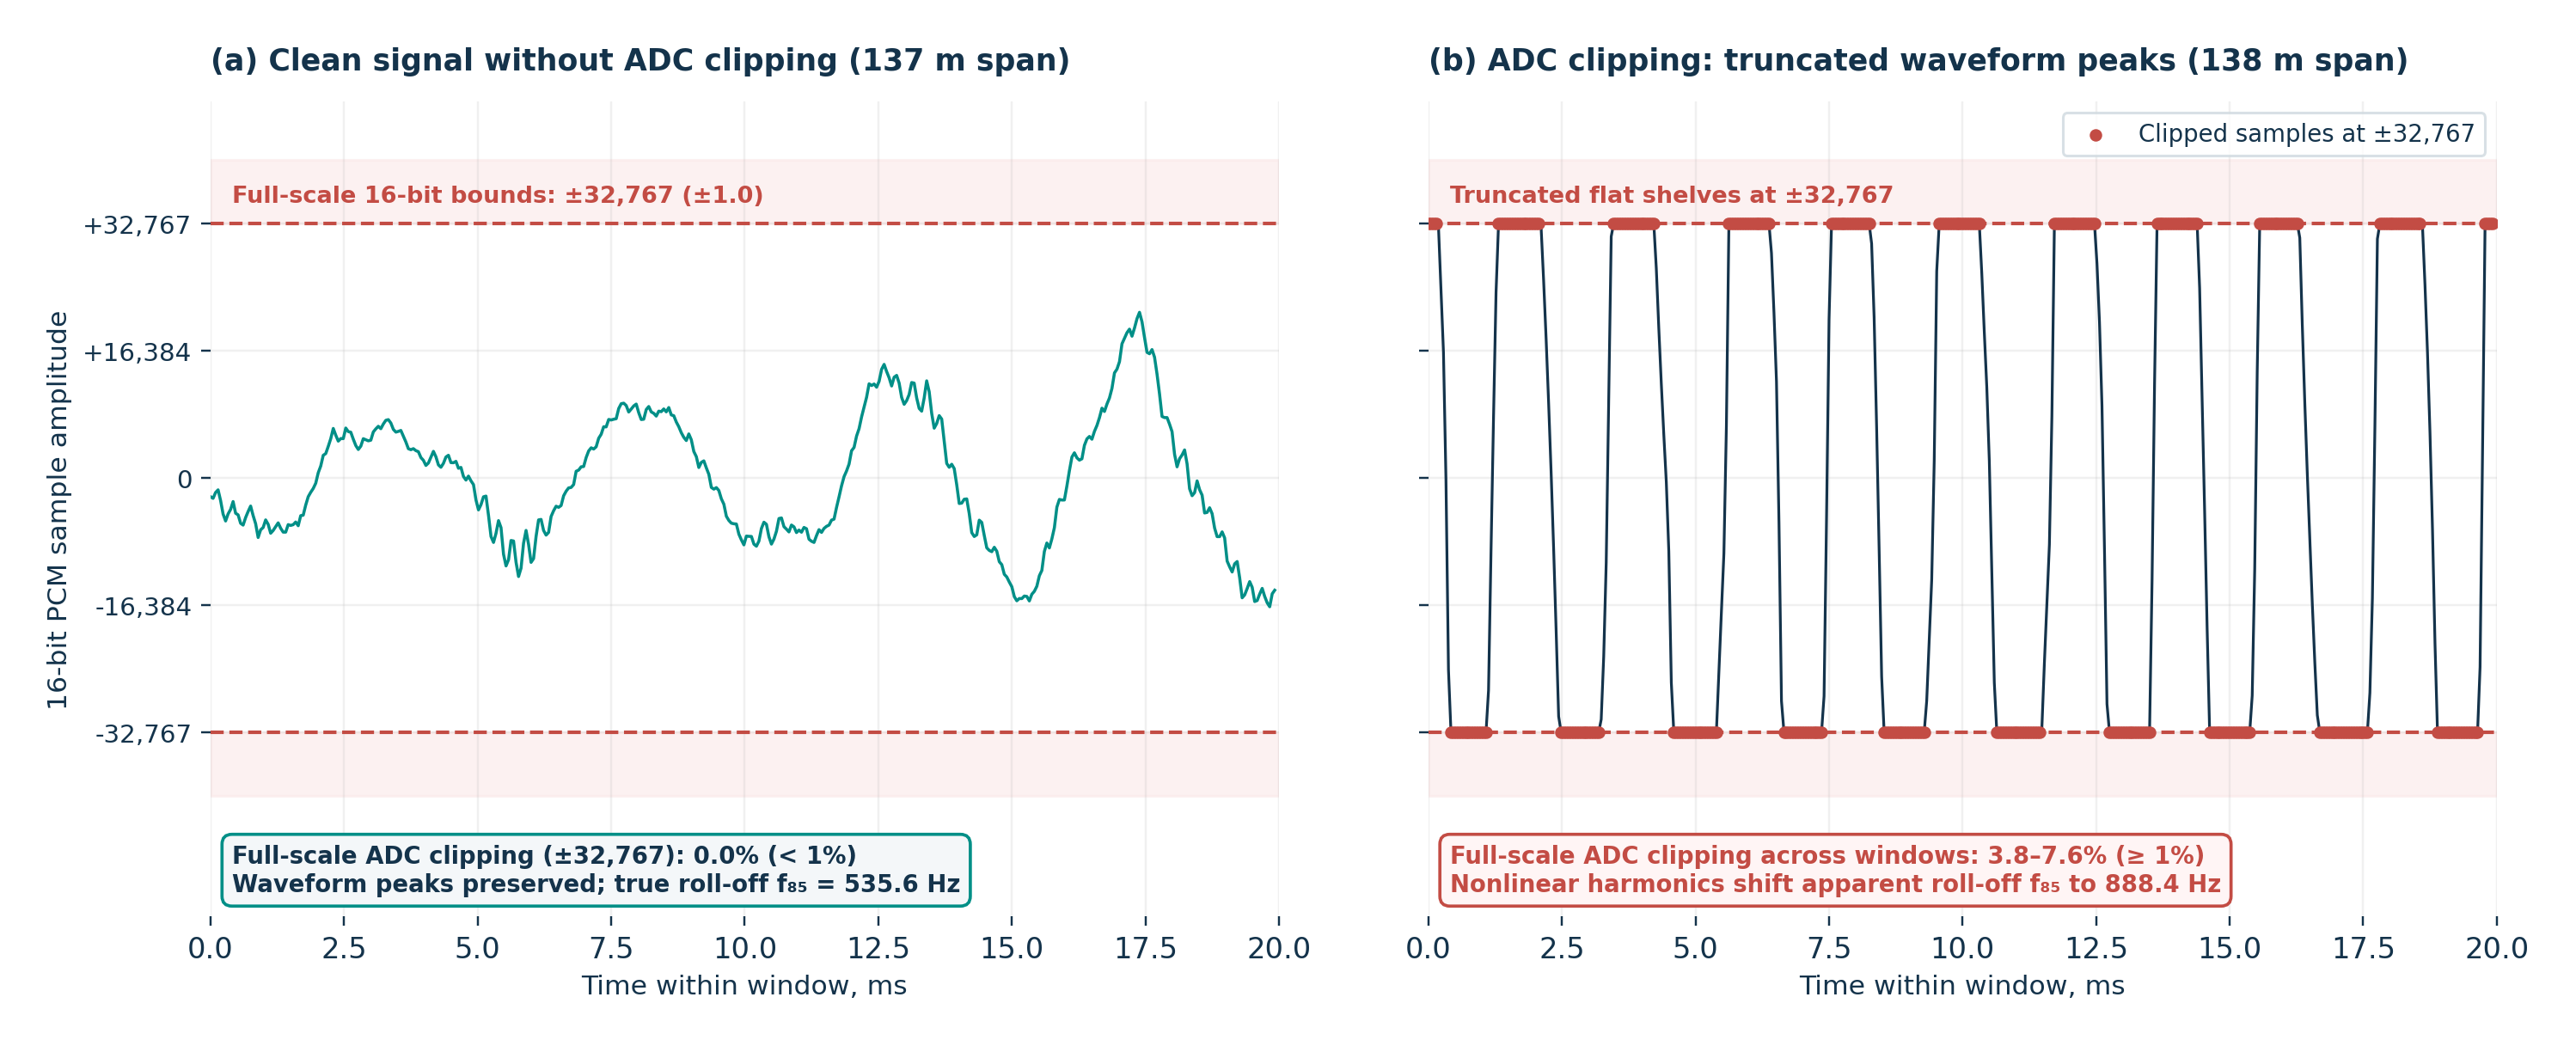
Fig. 5. 16-bit PCM waveforms over 20 ms segments (DN 700 / NPS 28): (a) clean unclipped signal on the 137 m span; (b) ADC clipping on the 138 m span with waveform peaks truncated at ±32,767 and high-frequency harmonic generation.
Under the fixed short-window baseline unaligned with propagation delay, 63 recordings met the ≥ 40 Hz coherence criterion, of which 57 received a distance band and 6 were rejected by the high-frequency filter (> 2,400 Hz without a confirmed Δt peak). Adapting Welch segment duration to span delay raised initial-window pass counts to 74 (+11), and scanning across the full recording duration recovered uncorrupted intervals for 8 more captures (82, or 55.4% of 148).
Scanning the complete 148-record verification corpus for full-scale ADC clipping (≥ 1% clipped samples in at least one window) identified 37 affected files, of which 31 contained a clean unclipped interval and 6 suffered continuous full-duration ADC clipping (most of the latter also failed coherence < 40 Hz). Within the 82 coherent recordings, 9 showed transient or continuous ADC clipping: clean intervals were recovered for 7, while 2 continuously clipped recordings were blocked (82 → 80).
Whenever contiguous coherence falls below 40 Hz, inverting span length via L = c · |Δt| is mathematically ill-posed: for any interior source (0 < x1 < L), the ratio L / (c · |Δt|) = 1 / |2 x1 / L − 1| maps onto [1, ∞) and diverges unboundedly as x1 → L / 2.
6. Reference Evaluation on 35 Pipe Records and Comparison of 137 m and 138 m Spans
Reference validation was performed across all 35 stereo recordings in the archive carrying a documented span length L (20 labeled "leak", 12 unlabeled, and 3 with conflicting folder labels; Table 2, Fig. 6). Both 95% Wilson score confidence intervals (CI) and point proportions are reported, and spectral range agreement with pipe-record geometry is strictly distinguished from confirmed Δt delay peak localization.
Table 2. Reconciled Evaluation Summary across 35 Recordings Carrying Pipe-Record Length L
| Verification Status in Current Gate | Count (/35) | Share (95% Wilson score CI) | Labels | Span Lengths and Diagnostic Notes |
|---|---|---|---|---|
| Coherent band < 40 Hz (abstain [12, 15]) | 18 | 51.4% | 7 leak, 8 unlabeled, 3 conflicting | 17 incoherent (incl. 3 on 138 m: 0.6–15.0 Hz) and 1 silent channel (138 m, 0 Hz) |
| HF roll-off > 2,400 Hz without Δt peak | 5 | 14.3% | 5 leak | Spans 49, 77, 77, 138, 138 m (inspect sensor mounting / pipe record) |
| Continuous ADC clipping (≥ 1% in all windows) | 1 | 2.9% | 1 leak | 138 m span: 3.8–7.6% ADC clipping at ±32,767; roll-off shifted to 888.4 Hz |
| Admitted · frequency range mismatch | 1 | 2.9% | 1 unlabeled | Unlabeled 206 m span assigned medium band (f85 = 910.3 Hz) |
| Admitted · range match with pipe record | 10 | 28.6% (16.3–45.1%) | 7 leak, 3 unlabeled | 7 of 7 "leak" (62, 62, 64, 64, 71, 71, 137 m) and 3 unlabeled (111, 206, 206 m) |
| Total admitted to range estimation | 11 | 31.4% (18.6–48.0%) | 7 leak, 4 unlabeled | Pipe-record match 10/11 = 90.9% (62.3–98.4%); 3 have Δt peak |
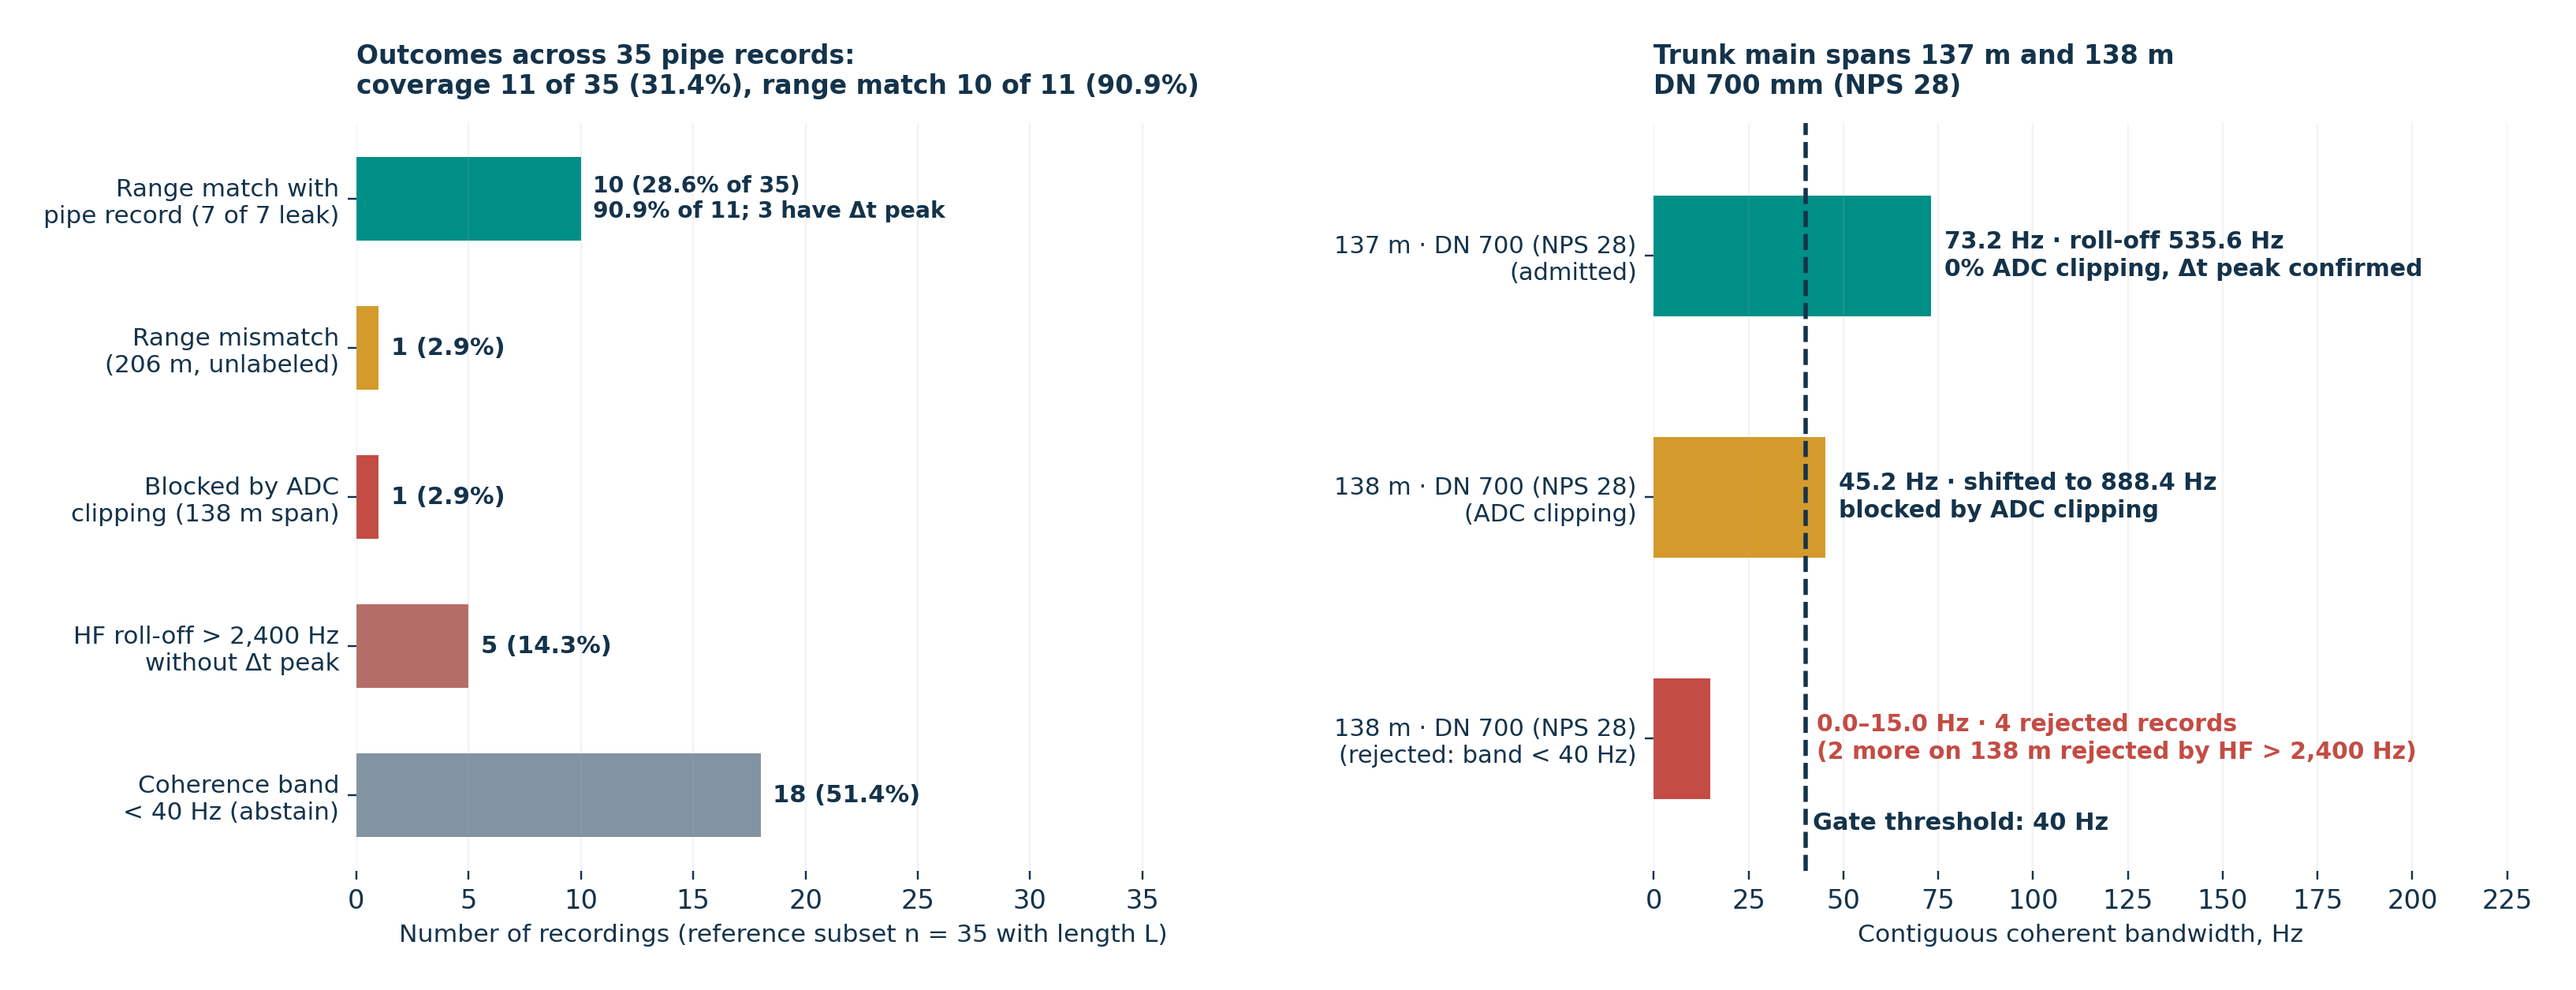
Fig. 6. Left: outcome distribution across the 35 pipe records (coverage 11 of 35 = 31.4%, range match 10 of 11 = 90.9%, with 3 exhibiting confirmed Δt delay peaks). Right: comparison of DN 700 (NPS 28) trunk main captures at 137 m and 138 m.
Principal Findings on the Reference Subset:
-
Pipe-record range agreement and subset structure. Relative to the earlier baseline (8 of 35 = 22.9%), signal-gate coverage rose to 11 of 35 (31.4%; 95% Wilson score CI: 18.6–48.0%). Among admitted captures, the estimated frequency range matched the pipe-record span length on 10 of 11 (90.9%; 95% Wilson score CI: 62.3–98.4%), corresponding to 28.6% of the full 35-record reference set (10/35).
-
Comparison of 137 m and 138 m trunk mains (DN 700 / NPS 28). The 1 m nominal proximity of 137 m and 138 m records on identical pipe class (DN 700) suggests a working hypothesis that they represent adjacent segments of the same trunk corridor or a 1 m surface survey discrepancy between field logs. Instrumentally, however, the captures are starkly distinct (Fig. 6, right): one 138 m capture exhibited a 45.2 Hz coherent band yet clipped at full scale in 3.8–7.6% of ADC samples across every temporal window. Flat-top waveform truncation injected spurious nonlinear harmonics, shifting apparent spectral roll-off f85 upward to 888.4 Hz (whereas an earlier baseline lacking an ADC clipping gate assigned a cutoff near 518 Hz), so the current gate blocks this capture. Remaining 138 m files either failed coherence (4 captures, 0.0–15.0 Hz) or were rejected by the HF anomaly gate (2 captures, > 2,400 Hz). Conversely, the clean neighboring 137 m capture maintained 0% ADC clipping, a broad 73.2 Hz coherent band, a low waveguide roll-off at 535.6 Hz, and a confirmed Δt correlation peak.
7. Field Inspection Protocol and Separate Gates for AI Dataset Construction
7.1. Field Inspection Engineer Checklist
Low inter-channel coherence γ2(f) < 0.30 proves neither a "quiet, no-leak pipe" nor sensor failure. As shown in Fig. 1 (right), 37 of 50 (74.0%) verified "no-leak" captures naturally lack a broadband common-mode source spanning both transducers. In operational practice, sub-threshold coherence serves strictly as an inspection trigger for sensor seating, cabling, line pressure, and operating regime (Table 3).
Table 3. Field Inspection Engineer Action Protocol Driven by Automated Intake Diagnostics
| Intake Diagnostic Output | Physical Interpretation | Required Field Action |
|---|---|---|
| Signal gate passed and pipe record (L, Din, e) verified | Valid two-sensor coupling, clean ADC headroom, consistent spectrum | Execute standard cross-correlation localization with true (L, Din, e) |
| Transition-zone span (50–70 m or 100–120 m) | Span lies near attenuation-band cutoff | Apply continuous logistic band weighting; re-verify sensor placement geometry |
| Continuous ADC clipping (≥ 1% across all windows) | Waveform peaks truncated at full digital scale throughout file | Hard Block. Attenuate preamplifier gain by 6–12 dB and re-acquire capture |
| Coherent bandwidth < 40 Hz (for K ≥ 10) | No stationary broadband acoustic link between sensors | Abstain from auto-localization [12, 15]. Check coupling, cables, pressure; narrow band advisory only |
| Delay implies Lmin = c · abs(Δt) > Lrecord | Acoustic path difference exceeds surface survey length L | Audit route & velocity: verify bends/loops, surface survey length L, wave speed c (gas pockets), or interference |
| HF roll-off > 2,400 Hz without Δt or on L > 115 m | Strong spectral mismatch with buried span physics | Audit record & burial: verify open excavation pit / utility duct, true (Din, e), and WAV linkage |
7.2. Consistent Dual-Track AI Dataset Architecture
To resolve the selection-bias contradiction whereby enforcing two-sensor coherence discards quiet "no-leak" captures [14] or conflates incompatible hardware fleets, machine-learning dataset curation must enforce two decoupled tracks (Table 4):
- Track A (Binary leak / no-leak classification): The ≥ 40 Hz coherence gate must not be applied. This pool retains all consistently labeled clean mono recordings (355: 143 leak / 212 no-leak) together with canonically labeled stereo captures free of full-duration ADC clipping (131: 81 leak / 50 no-leak out of 133 canonically labeled stereo files, subject to full-duration ADC clipping screening across the incoherent subset), totaling up to 486 clean labeled signals. Critical hardware confound: the stereo stream carries 62.4% leak prevalence (83/133) at fs = 21–22 kHz, whereas the mono stream carries 40.3% leak prevalence (143/355) at fs = 1.6–8.1 kHz. Naive pooling without bandwidth equalization and hardware stratification lets classifiers exploit channel count and Nyquist cutoff as spurious shortcuts. Models must either be trained per hardware class or strictly resampled into a common passband with stratified sampling.
- Track B (Distance-range estimation and coordinate regression Δx): Admission is restricted strictly to synchronized two-channel recordings clearing the primary signal gate (80 signals: 63 leak, 13 no-leak, 4 unlabeled). Supervised coordinate regression further requires verified pipe geometry: within the 35-record reference set, 11 clear the range gate (10 matching pipe-record class) and 3 leak captures exhibit confirmed delay peaks Δt (64, 64, and 137 m).
Table 4. Decoupled Validation Gates for AI Training Dataset Curation
| Data Category and Curation Track | Archive Volume | Risk Without Barrier | Dataset Curation Protocol |
|---|---|---|---|
| Track A · "Leak / no-leak" classification (1-ch. + 2-ch.) | 355 mono + 131–133 stereo | Selection bias from dropping 74% quiet "no-leak" spans [14]; hardware shortcutting | Omit coherence gate; cluster/campaign block split [24]; stratify & match passband |
| Track B1 · 2-ch. distance-range signal gate | 80 stereo (of 148) | Clipping-inflated f85; short-window failure on long spans | Require coherence ≥ 40 Hz (K ≥ 10) + ADC clipping < 1%; abstain on fail [12, 15] |
| Track B2 · Coordinate localization candidates (Δx) | 3 stereo with Δt peak (of 35 with L) | Coordinate bias from unverified surface length L | Admit only after instrumental audit of (L, Din, e) |
| Byte/audio duplicates, label conflicts & synthetics | 600 copies, 5 conflicts, 45 tests | Train-test copy leakage [16, 17]; opposing gradients; generator overfitting | Cluster into 935 audio groups; quarantine conflicts and synthetics pre-split |
8. Audit Findings: Measurements, Calculations, Hypotheses, and Recommendations
8.1. Measured Facts Confirmed in the Archive
- Out of 1,580 transferred WAV files, 45 are synthetically generated test signals, and the 1,535 operational captures contain 600 decoded-audio duplicates (596 byte-identical), reducing the physical archive to 935 unique captures (733 mono and 202 stereo).
- The mono stream (1.6–8.1 kHz, median 3.1 s) contributes 355 labeled captures (143 leak / 212 no-leak); the stereo stream (21.3–22.1 kHz in 98% of files, median 120 s) contains 133 canonically labeled signals (83 leak / 50 no-leak), 5 contradictory label clusters, and 64 signals lacking canonical labels (15 carrying pipe-record length L and 2 residing in "leak" folders).
- Within the 148-record two-channel verification corpus, the ≥ 40 Hz coherent bandwidth criterion is met by 63 records in short initial windows, 74 after delay-adapted Welch segmentation, and 82 under full-duration scanning, of which 80 are free from full-duration ADC clipping (≥ 1%). Pass rates across the 83 labeled leak captures reach 78.3%, versus 26.0% across the 50 "no-leak" captures.
- Across 35 pipe-record captures, 11 (31.4%, 95% Wilson score CI 18.6–48.0%) passed into range estimation; 10 of 11 (90.9%, CI 62.3–98.4%; 28.6% overall) agreed with pipe-record distance classes, and 3 leak captures yielded confirmed delay peaks (64, 64, and 137 m). One 138 m file with 45.2 Hz coherence exhibited 3.8–7.6% ADC clipping shifting its roll-off to 888.4 Hz.
8.2. Verified by Engineering Calculation
- Perturbing the cross-correlation and Korteweg equations [19] confirms that span length error ΔL shifts coordinates linearly by ΔL / 2, whereas geometry variation X = Din/e induces δc / c = −(1/2) · [αX / (1 + αX)] · (δX / X): confusing DN 150 and DN 200 (NPS 6 and 8) changes c by less than 0.5%, and substituting nominal DN 200 for true internal diameter Din alters velocity by 0.47%.
- By Carter's quantile relation [11], enforcing γ2 ≥ 0.30 requires at least 10–15 Welch averages (γ20.95(10) = 0.283 versus γ20.95(5) = 0.527).
- Length inversion via L = c · |Δt| below 40 Hz diverges as 1 / |2 x1 / L − 1| whenever a source approaches mid-span.
8.3. Working Engineering Hypotheses
- Directory-level label conflicts across 5 duplicate groups (28 files) and mismatched pipe records (44 vs. 49 m, 137 vs. 138 m on DN 700 / NPS 28) likely stem from inconsistent directory curation and archival merging of adjacent or re-surveyed trunk segments.
- The narrowband 180–480 Hz spectral peak on the 36 m open excavation pit (DN 200 / NPS 8) is hypothesized to arise from a localized flexural or standing mode of that open excavation pit segment rather than an axisymmetric shell ring mode (3–8 kHz).
- High-frequency roll-off depression and low coherence on specific field spans are attributed to attenuation in soil, poor sensor contact, or gas in water.
8.4. Actionable Recommendations
- Enforce grouped block partitioning strictly over the 935 audio-hash clusters and physical survey campaigns while isolating all 45 synthetic files and 5 contradictory label clusters prior to dataset assembly.
- Separate AI training workflows into Track A leak/no-leak classification (355 mono + 131–133 clean stereo with mandatory hardware stratification and common-band resampling) and Track B correlation distance/localization modeling (80 signal-gated stereo captures).
- Upgrade pipe survey records from nominal size indices DN (NPS) alone to measured internal diameter and wall thickness (Din, e), water temperature T, and surveyed span length L.
Author Contributions
Aleksandr Ivanaiskii, PhD (Founder & CEO, Rivixi LLC) led study conceptualization, methodology, model development, software implementation, experimental evaluation, and manuscript preparation. Evgeny Ivanaiskii, PhD (Independent Researcher, Pipeline NDT) contributed domain expertise and independent technical review. Sergei Shipilov (AI Engineer) contributed AI engineering, software implementation, and reporting support.
References
- Plain end steel tubes, welded and seamless: General tables of dimensions and masses per unit length, ISO 4200:1991, International Organization for Standardization, Geneva, Switzerland, 1991.
- Pipework components: Definition and selection of DN (nominal size), ISO 6708:1995, International Organization for Standardization, Geneva, Switzerland, 1995.
- Welded and Seamless Wrought Steel Pipe, ASME B36.10-2022, ASME, New York, NY, USA, 2022.
- Standard Specification for Pipe, Steel, Black and Hot-Dipped, Zinc-Coated, Welded and Seamless, ASTM A53/A53M-24, ASTM International, West Conshohocken, PA, USA, 2024, doi: 10.1520/A0053_A0053M-24.
- Steel Water Pipe, 6 In. (150 mm) and Larger, ANSI/AWWA C200-23, American Water Works Association, Denver, CO, USA, 2023.
- D. Dechant and J. Bambei, AWWA Manual M11: Steel Pipe: A Guide for Design and Installation, 5th ed. Denver, CO, USA: American Water Works Association, 2017.
- Seamless and welded steel tubes: Dimensions and masses per unit length, EN 10220:2002, CEN, Brussels, Belgium, 2002.
- District heating pipes: Design and installation of thermal insulated bonded single and twin pipe systems for directly buried hot water networks, Part 1: Design, EN 13941-1:2019+A1:2021, CEN, Brussels, Belgium, 2021.
- J. S. Bendat and A. G. Piersol, Random Data: Analysis and Measurement Procedures, 4th ed. Hoboken, NJ, USA: Wiley, 2010, ISBN 978-0-470-24877-5.
- G. C. Carter, "Coherence and time delay estimation," Proceedings of the IEEE, vol. 75, no. 2, pp. 236–255, 1987, doi: 10.1109/PROC.1987.13723.
- G. C. Carter, C. H. Knapp, and A. H. Nuttall, "Estimation of the magnitude-squared coherence function via overlapped fast Fourier transform processing," IEEE Transactions on Audio and Electroacoustics, vol. AU-21, no. 4, pp. 337–344, 1973, doi: 10.1109/TAU.1973.1162496.
- C. K. Chow, "On optimum recognition error and reject tradeoff," IEEE Transactions on Information Theory, vol. 16, no. 1, pp. 41–46, 1970, doi: 10.1109/TIT.1970.1054406.
- C. R. Fuller and F. J. Fahy, "Characteristics of wave propagation and energy distributions in cylindrical elastic shells filled with fluid," Journal of Sound and Vibration, vol. 81, no. 4, pp. 501–518, 1982.
- J. J. Heckman, "Sample selection bias as a specification error," Econometrica, vol. 47, no. 1, pp. 153–161, 1979, doi: 10.2307/1912352.
- K. Hendrickx, L. Perini, D. Van der Plas, W. Meert, and J. Davis, "Machine learning with a reject option: a survey," Machine Learning, vol. 113, pp. 3073–3110, 2024, doi: 10.1007/s10994-024-06534-x.
- S. Kapoor and A. Narayanan, "Leakage and the reproducibility crisis in machine-learning-based science," Patterns, vol. 4, no. 9, Art. no. 100804, 2023, doi: 10.1016/j.patter.2023.100804.
- S. Kaufman, S. Rosset, C. Perlich, and O. Stitelman, "Leakage in data mining: formulation, detection, and avoidance," ACM Transactions on Knowledge Discovery from Data, vol. 6, no. 4, Art. no. 15, 2012, doi: 10.1145/2382577.2382579.
- C. H. Knapp and G. C. Carter, "The generalized correlation method for estimation of time delay," IEEE Transactions on Acoustics, Speech, and Signal Processing, vol. 24, no. 4, pp. 320–327, 1976, doi: 10.1109/TASSP.1976.1162830.
- D. J. Korteweg, "Ueber die Fortpflanzungsgeschwindigkeit des Schalles in elastischen Röhren," Annalen der Physik und Chemie, Neue Folge, vol. 5, pp. 525–542, 1878, doi: 10.1002/andp.18782411206.
- A. W. Leissa, Vibration of Shells, NASA SP-288, National Aeronautics and Space Administration, Washington, DC, USA, 1973.
- J. M. Muggleton, M. J. Brennan, and P. W. Linford, "Axisymmetric wave propagation in fluid-filled pipes: wavenumber measurements in in vacuo and buried pipes," Journal of Sound and Vibration, vol. 270, no. 1–2, pp. 171–190, 2004, doi: 10.1016/S0022-460X(03)00489-9.
- J. M. Muggleton, M. J. Brennan, and R. J. Pinnington, "Wavenumber prediction of waves in buried pipes for water leak detection," Journal of Sound and Vibration, vol. 249, no. 5, pp. 939–954, 2002, doi: 10.1006/jsvi.2001.3881.
- R. J. Pinnington and A. R. Briscoe, "Externally applied sensor for axisymmetric waves in a fluid filled pipe," Journal of Sound and Vibration, vol. 173, no. 4, pp. 503–516, 1994.
- D. R. Roberts, V. Bahn, S. Ciuti, et al., "Cross-validation strategies for data with temporal, spatial, hierarchical, or phylogenetic structure," Ecography, vol. 40, no. 8, pp. 913–929, 2017, doi: 10.1111/ecog.02881.
- W. Wagner and A. Pruß, "The IAPWS Formulation 1995 for the Thermodynamic Properties of Ordinary Water Substance for General and Scientific Use," Journal of Physical and Chemical Reference Data, vol. 31, no. 2, pp. 387–535, 2002, doi: 10.1063/1.1461829.
- P. D. Welch, "The use of fast Fourier transform for the estimation of power spectra: a method based on time averaging over short, modified periodograms," IEEE Transactions on Audio and Electroacoustics, vol. AU-15, no. 2, pp. 70–73, 1967.